Difference between revisions of "ATM Equipment Management"
Jump to navigation
Jump to search
imported>Dpltech |
imported>Dpltech |
||
| Line 28: | Line 28: | ||
; B. Info | ; B. Info | ||
; C. Settings | ; C. Settings | ||
| − | ; D. Diagnostics: | + | ; D. Diagnostics: Displays connectivity and diagnostic information about the DPL device. |
== Reports Tab == | == Reports Tab == | ||
Contains links to reports filtered on the current equipment. | Contains links to reports filtered on the current equipment. | ||
Revision as of 17:33, 18 January 2017
The ATM Equipment Management screen displays information about a single piece of equipment organised into tabbed sections described bellow.
Dashboard Tab
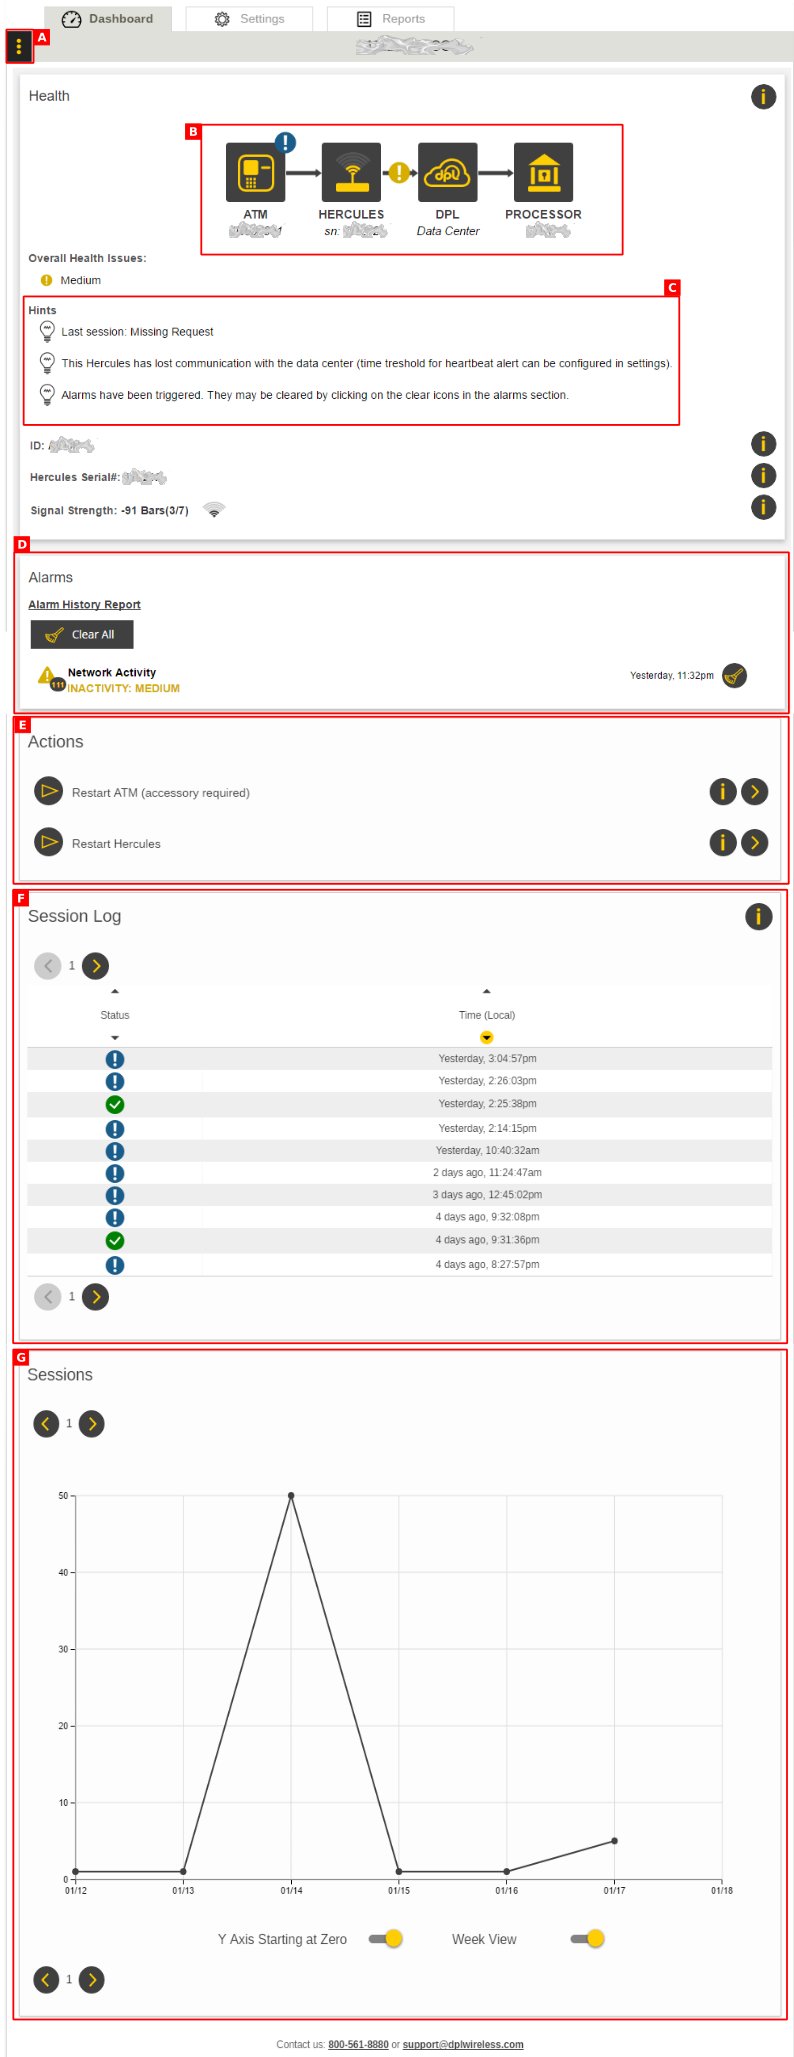
The Dashboard Tab displays health, uncleared alarms, actions, session log and sessions graph.
- A. Menu with shortcuts available here
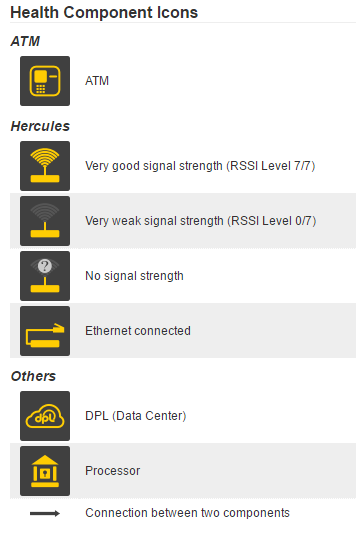
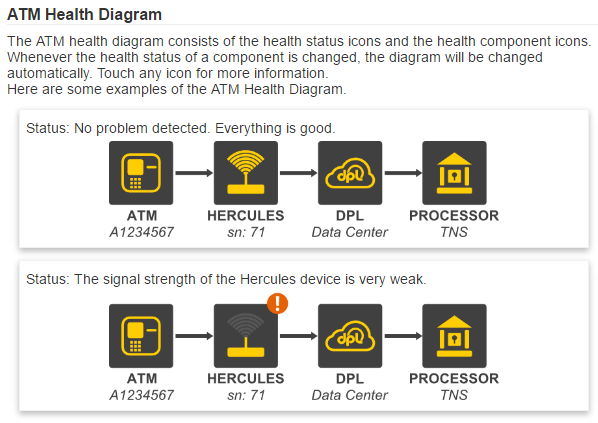
- B. Health diagram
- C. Hints
- D. Uncleared Alarms
- When alarms have been triggered, they will be shown in the alarms section. They may be cleared by clicking on the clear icons.
- E. Actions
- F. Session Log
- Summary of sessions (Two weeks of data available). Click on status icon to see more information.
- G. Sessions Graph
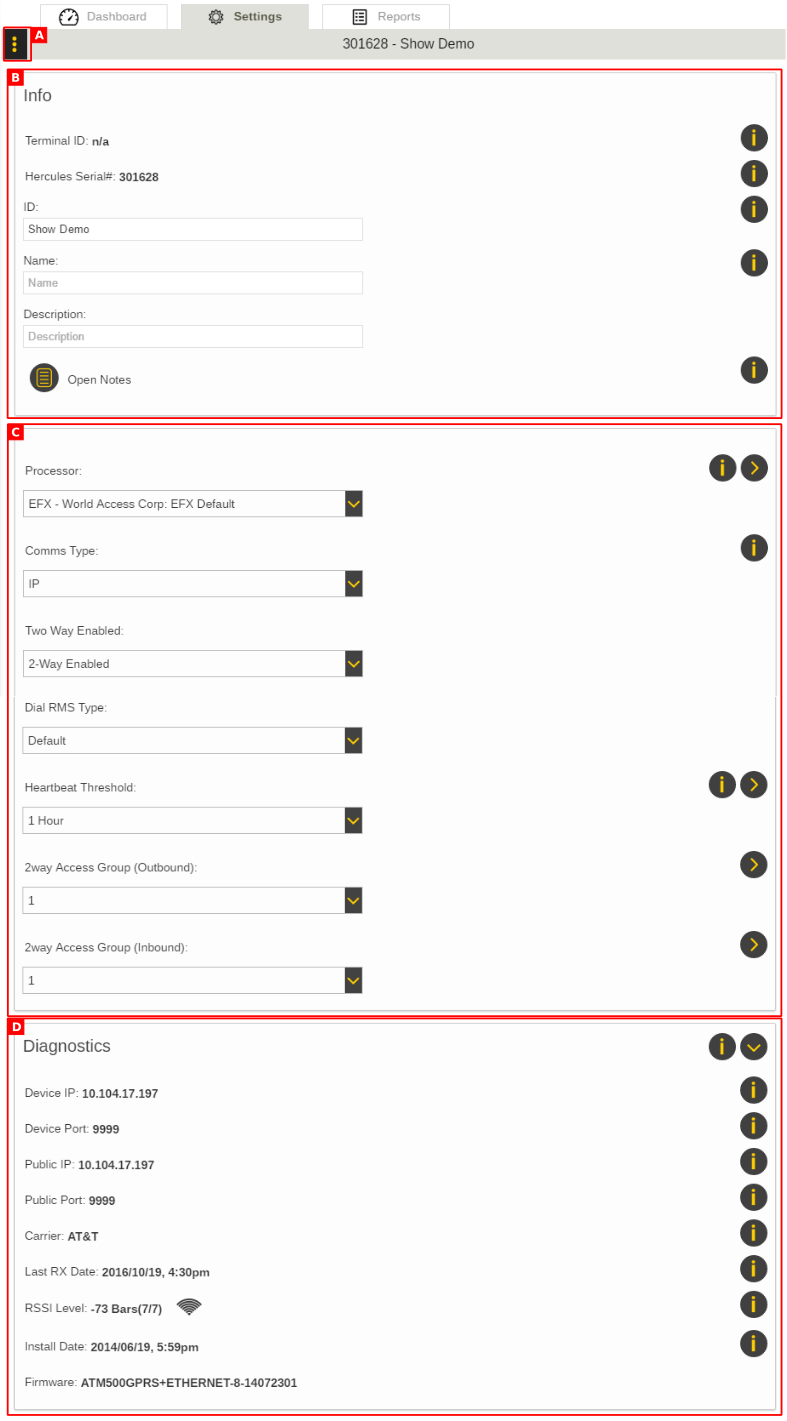
Settings Tab
- A. Menu with shortcuts available here
- B. Info
- C. Settings
- D. Diagnostics
- Displays connectivity and diagnostic information about the DPL device.
Reports Tab
Contains links to reports filtered on the current equipment.


