Difference between revisions of "Graph Mode"
Jump to navigation
Jump to search
imported>Dpltech (→Graph Mode) |
imported>Dpltech (→Graph Mode) |
||
| Line 13: | Line 13: | ||
:;G. Show/Hide Grid | :;G. Show/Hide Grid | ||
:;H. Full Y Scale Mode: The range of Y scale is rendered from minimum value to maximum value by default. A user can change it from zero to maximum value by clicking this. | :;H. Full Y Scale Mode: The range of Y scale is rendered from minimum value to maximum value by default. A user can change it from zero to maximum value by clicking this. | ||
| + | :;J. Paging: Move a timespan with a pagesize(I) | ||
Latest revision as of 18:23, 7 October 2015
__NOTITLE__
Graph Mode
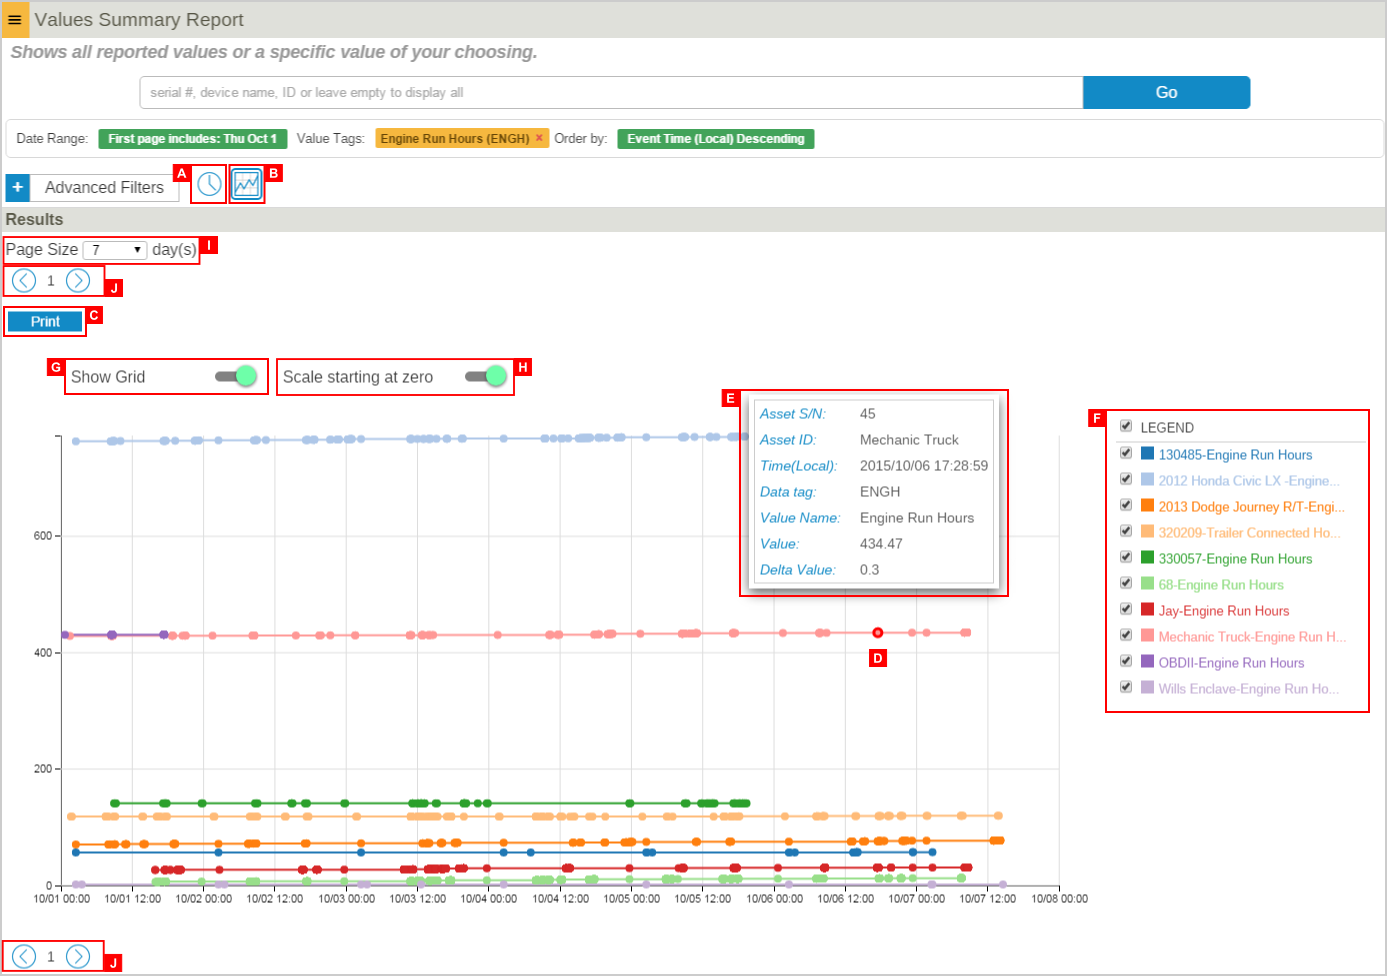
- A. Table Mode
- Switch to the Table Report View.
- B. Graph Mode
- Switch to the Graph Report View.
- C. Print
- Print Graph Or Save as Pdf.
- D. Data Point
- To see (E) More Info, hover over a data point.
- E. More Info
- Shows device info, event time, datatag, value name, value, and delta value.
- F. Legend
- Show/Hide a line graph. You will notice that the Y scale is updated dynamically.
- G. Show/Hide Grid
- H. Full Y Scale Mode
- The range of Y scale is rendered from minimum value to maximum value by default. A user can change it from zero to maximum value by clicking this.
- J. Paging
- Move a timespan with a pagesize(I)
