Difference between revisions of "Equipment Management"
Jump to navigation
Jump to search
imported>Dpltech |
imported>Dpltech (→Dashboard Tab) |
||
| Line 16: | Line 16: | ||
Clicking on an alarm are value row displays a quick event history. A full history report for the current equipment can be opened with the history icon ('''E'''). For values, you can open a report in graph mode using '''H'''. | Clicking on an alarm are value row displays a quick event history. A full history report for the current equipment can be opened with the history icon ('''E'''). For values, you can open a report in graph mode using '''H'''. | ||
| − | |||
| − | |||
| − | |||
| − | |||
| − | |||
| − | |||
| − | |||
| − | |||
| − | |||
| − | |||
| − | |||
| − | |||
| − | |||
| − | |||
| − | |||
| − | |||
| − | |||
| − | |||
| − | |||
| − | |||
| − | |||
| − | |||
| − | |||
| − | |||
| − | |||
| − | |||
| − | |||
| − | |||
Revision as of 17:06, 5 June 2015
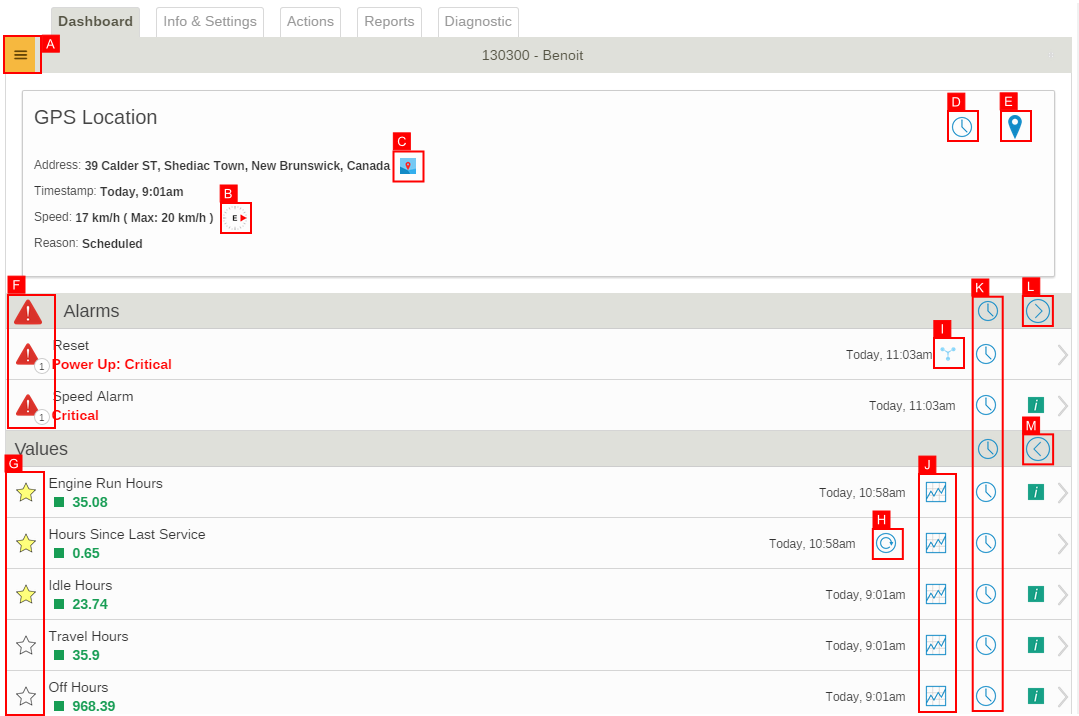
The Equipment Management screen displays information about a single piece of equipment organised into tabbed sections described bellow.
Dashboard Tab
The Dashboard Tab displays location, alarm and value information.
- A. Quick Map Button
- Opens Quick Map popup.
- B. Location History Button
- Opens the Location History Report for this equipment.
- C. Map Button
- Opens mapping for this equipment.
- D. Alarm Level Icons
- The top alarm level icon next to the Alarms section header shows the max active alarm level for the current equipment. Each (grouped) alarm also has its own alarm level icon. Clicking on these icons dismisses the alarm.
- F. Show All Alarms Button
- Toggles between showing only active alarms or all alarms even those that have been dismissed.
- G. Show All Values Button
- Toggles between showing only favorite values or all values.
Clicking on an alarm are value row displays a quick event history. A full history report for the current equipment can be opened with the history icon (E). For values, you can open a report in graph mode using H.
