Difference between revisions of "Graph Mode"
Jump to navigation
Jump to search
imported>Dpltech (→Graph Mode) |
imported>Dpltech (→Graph Mode) |
||
| Line 12: | Line 12: | ||
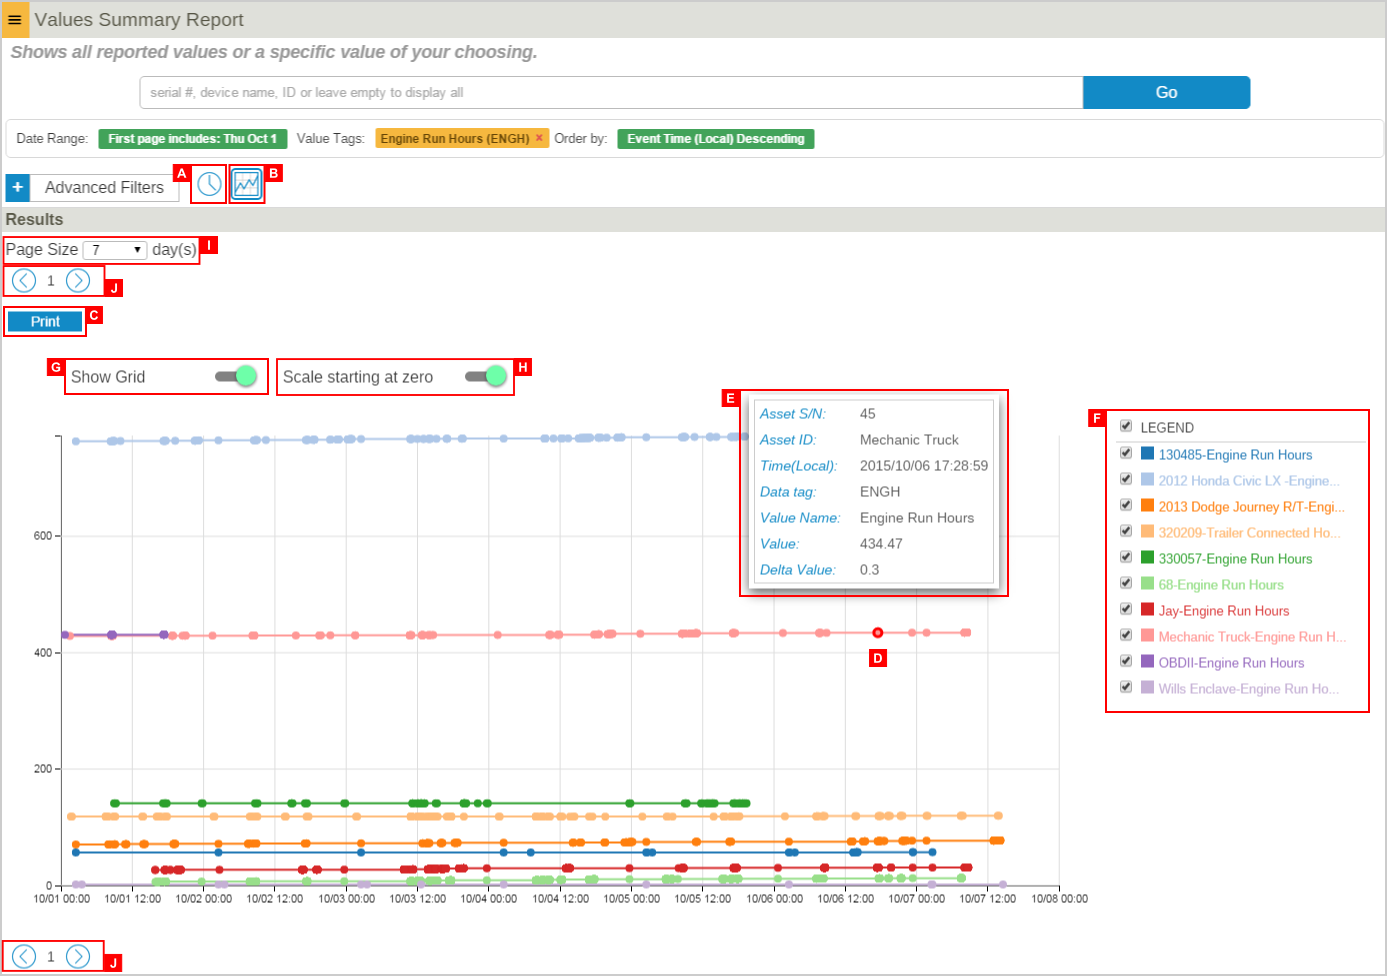
:;F. Legend: | :;F. Legend: | ||
:;G. Show/Hide Grid: | :;G. Show/Hide Grid: | ||
| − | :;H. Full Y Scale Mode: The range of Y scale is rendered from minimum value to maximum value by default. A user can change it from zero to maximum value by clicking this | + | :;H. Full Y Scale Mode: The range of Y scale is rendered from minimum value to maximum value by default. A user can change it from zero to maximum value by clicking this. |
