Difference between revisions of "Device Dashboard"
Jump to navigation
Jump to search
imported>Sartainm |
imported>Sartainm |
||
| Line 4: | Line 4: | ||
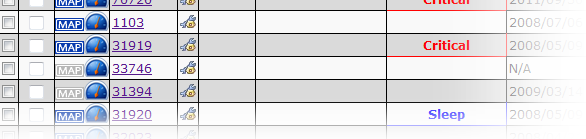
Next to each device, you will notice the gauge icon. | Next to each device, you will notice the gauge icon. | ||
| − | [[File:Dd1.png]]<br> | + | [[File:Dd1.png|link=]]<br> |
Clicking this icon will bring up the Dashboard view of that device. | Clicking this icon will bring up the Dashboard view of that device. | ||
| − | [[File:Dash1.png]]<br> | + | [[File:Dash1.png|link=]]<br> |
<pre> | <pre> | ||
Latest revision as of 18:54, 14 May 2013
__NOTITLE__
Device Dashboard
Next to each device, you will notice the gauge icon.
Clicking this icon will bring up the Dashboard view of that device.
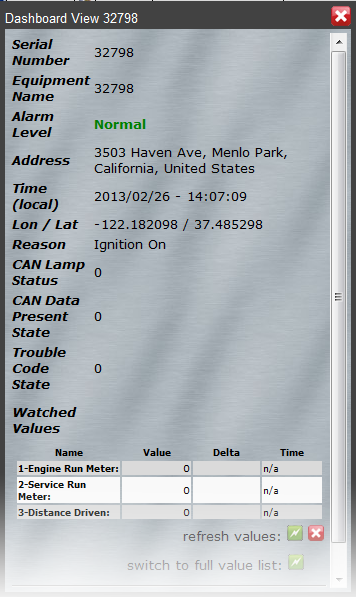
The device dashboard allows for quick viewing of important, device specific data right at your fingertips.
You can also fetch in real-time, almost any piece of data that the device records. Everything from Alarms, to Regions to Recently Sent Tasks.
The content of the dashboard is configurable on the options page. Dashboard Config section allows users to select which info
to display on the dashboard and the watched values selection section allows users to select the individual values to show
when the dashboard initially appears.