Difference between revisions of "Reports"
Jump to navigation
Jump to search
imported>Dpltech (→Data Selection) |
imported>Dpltech (→Advanced Filtering) |
||
| Line 54: | Line 54: | ||
| − | [[File:AdvancedFiltersOnEqReport.png]] | + | :[[File:AdvancedFiltersOnEqReport.png]] |
| + | |||
| + | :[[File:AdvancedFiltersOnTimelineReport.png]] | ||
=== Equipment Selection === | === Equipment Selection === | ||
Revision as of 13:29, 8 June 2015
__NOTITLE__
Contents
Reports
There are five ways to see your report: Standard Reports, Custom Columns Reports, Scheduled Reports, Report History, and Report Shortcuts. Selecting the Reports button at the left brings you to the Standard Reports tab by default. The other kinds are available by selecting the other tabs. Using the reporting tools, you can easily view your data in printable and exportable reporting formats.
Standard Reports
- There are a number of pre-defined standard reports to choose from that make viewing essential data quickly and easily. Simply choose the report from the Standard Reports tab and click the View Report button.

Custom Columns Reports

- A. New
- Creates Custom Reports that target your reporting needs more precisely than that of the standard reports. This brings you to the New Report Configuration page where you can define your new custom columns report.
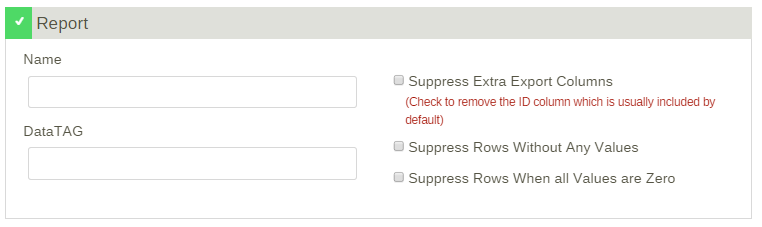
- Give your report a descriptive name, a DataTag and select the approproate options for your new report. Please note that in order to customize which columns appear in the report, you must select the Apply button. This saves your changes and enables the Add columns button.

- B. Schedule
- You have the ability to schedule custom columns reports. This brings you to the Schedule Report page where you can setup the schedule and apply some further options to the report generation. Give the new Scheduled Report a name, and move through the available options. You can assign the report to be generated for a particular Account, apply a Region filter and also generate the report for a certain equipment type. The remainging options define when the report will be generated, as well as generation offsets, day masks and ranges. You can also have the report be emailed to you via the email export options. Please note that you should not use your cellphone email address due to the potential size of the report.

- C. Config
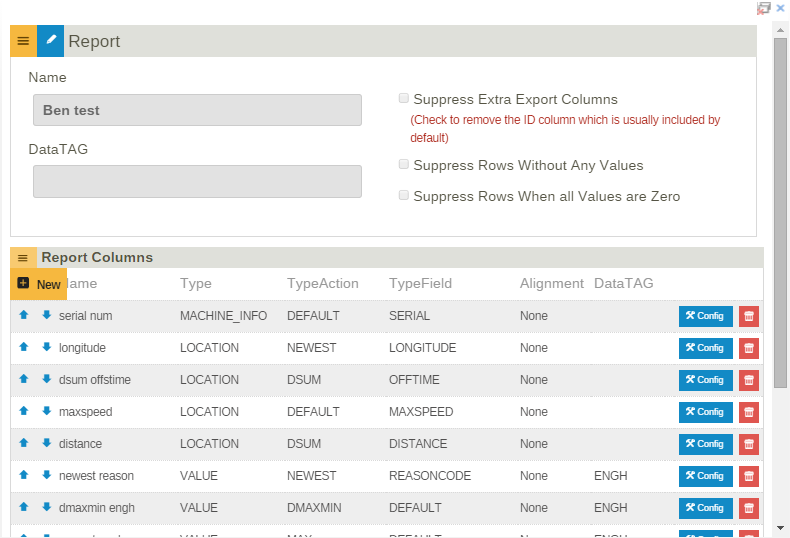
- Selecting the New column button brings you to the Add Report Column page. Here is where you define which column(s) will be included in the report. Give your column a name and select its type, action, field, alignment and Data Tag. You have 4 choices for Type; Machine Info, Value, Location and Alarm. Based on the Type selection, the options for Action and Field will change.


- D. View Report
Scheduled Reports
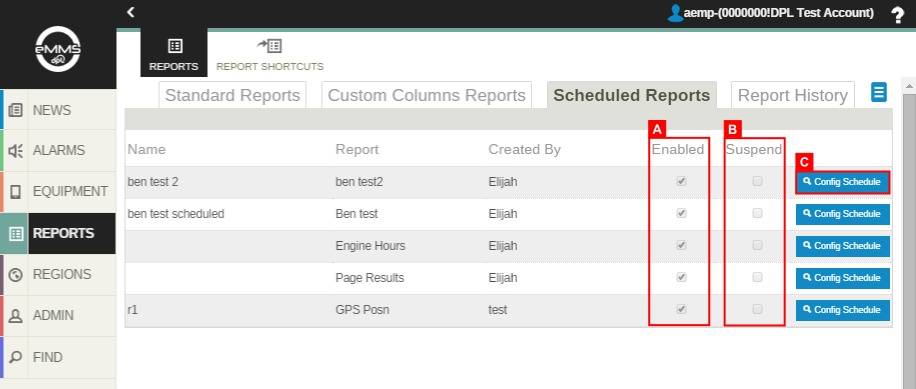
- A. Enabled
- A report will be scheduled only when it is checked.
- B. Suspend
- A report could have been suspended by the system as there is an error. Please fix and un-Suspend.
- C. Config Schedule
- See (B) Schedule of Custom Columns Reports.

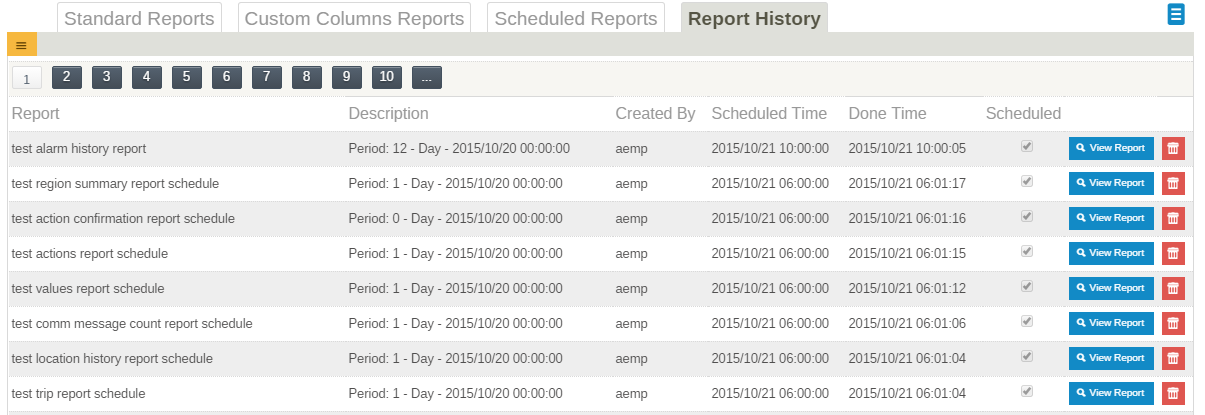
Report History
- A user can select and view a report from the Report History tab.

Report Shortcuts
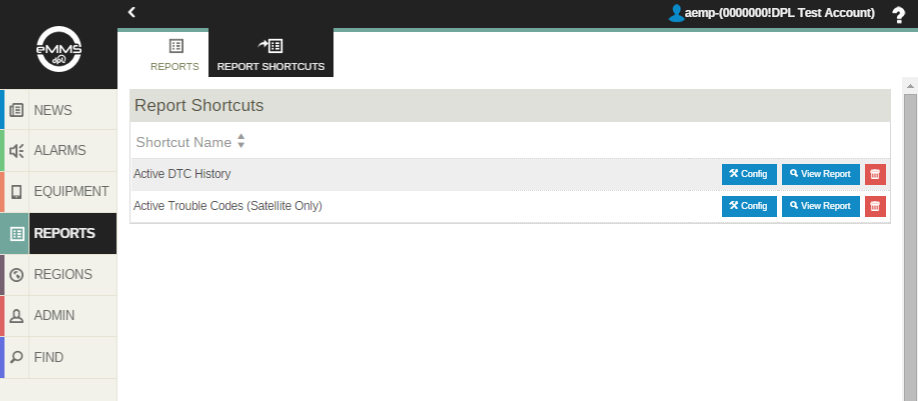
- A user also can select and view a report from the Report Shortcuts page. A report shortcut can be created from the expandable menu of a report as below.


Advanced Filtering
Advanced filtering allows you to apply search filters to your data so that you can view customized, detailed, quick reports for accessing the right information at the right time.


Equipment Selection
- You can choose to view only devices assigned to certain accounts, of particular equipment types and the devices last known equipment location.
Data Selection
- The data selection filters allow you to select as many rows as you choose and apply data specific filters to that data set. Filters include; Data locations, reason type and to prioritize active equipment. You can then sort those rows further by any viewable column in either ascending or descending order.
- If any of the filters are changed, the data will no longer reflect the current state of the filters. To indicate this situation, the Go button is shown in orange and must be clicked to re-query the report data with the currently selected filters.