Difference between revisions of "ATM Fleet View"
Jump to navigation
Jump to search
imported>Dpltech |
imported>Dpltech |
||
| Line 6: | Line 6: | ||
::eg. In this network of ATMs: | ::eg. In this network of ATMs: | ||
::[[File:FleetHealthDiagram.png]] | ::[[File:FleetHealthDiagram.png]] | ||
| − | <ul> | + | <ul style="list-style-type:disc;"> |
<li>10% of the ATMs are in critical health and 20% have health issues of low importance.</li> | <li>10% of the ATMs are in critical health and 20% have health issues of low importance.</li> | ||
<li>5% of the connection between ATMs and Hercules devices are in unknown health and 95% are in good health.</li> | <li>5% of the connection between ATMs and Hercules devices are in unknown health and 95% are in good health.</li> | ||
Revision as of 19:51, 17 January 2017
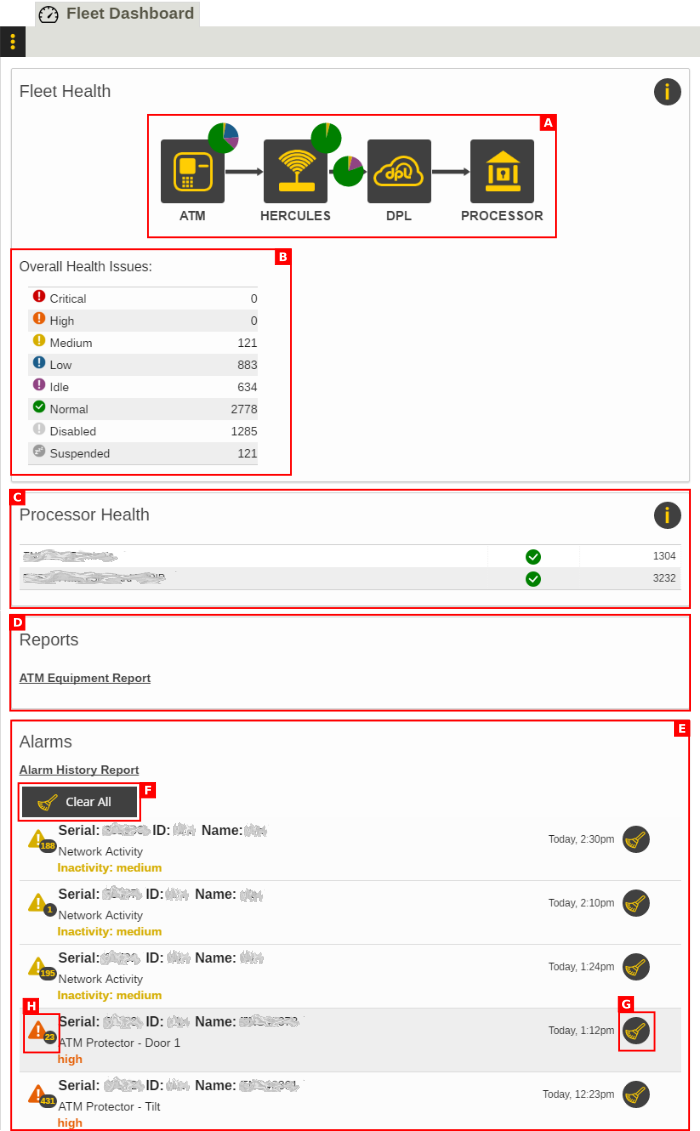
- A. Fleet Health Diagram
- The health of the account's whole network (fleet) of ATMs connected is shown. A circle on a part of fleet is like a "pie chart" showing how many of that part of the network are affected. Touch any icon for more information.
- 10% of the ATMs are in critical health and 20% have health issues of low importance.
- 5% of the connection between ATMs and Hercules devices are in unknown health and 95% are in good health.
- 13% of the Hercules have health issues of high importance and 87% have good health.
- 100% of the DPL data centers, the connection between Hercules and DPL, the connection between DPL and Processors are good in health.
- 8% of the Processors have health issues of medium importance and 92% are good in health.
- B. Overall Health Issues
- C. Processor Health
- D. Reports
- See ATM Equipment Report.
- E. Alarms
- F. Clear All Alarms
- G. Clear Alarm
- H. Open Alarm History

