Difference between revisions of "Equipment Management"
Jump to navigation
Jump to search
imported>Sartainm |
imported>Dpltech (→Info & Settings Tab) |
||
| (79 intermediate revisions by 2 users not shown) | |||
| Line 1: | Line 1: | ||
| − | |||
| − | + | The Equipment Management screen displays information about a single piece of equipment organised into tabbed sections described bellow. | |
| − | |||
| − | |||
| − | |||
| − | |||
| − | |||
| − | |||
| − | |||
| − | |||
| − | |||
| − | |||
| − | + | == Dashboard Tab == | |
| − | == | ||
| − | |||
| − | |||
| − | |||
| − | |||
| − | + | The Dashboard Tab displays location, alarm and value information. | |
| − | |||
| − | |||
| − | The | ||
| − | |||
| − | + | [[File:Equipmentmanagement.png]] | |
| − | |||
| − | |||
| − | |||
| − | [[File: | ||
| − | |||
| − | + | ; A. Menu with shortcuts available here | |
| − | + | ; B. Heading | |
| − | + | ; C. Quick Map Button: Opens Quick Map popup. | |
| − | + | ; D. Location History Button: Opens the Location History Report for this equipment. | |
| + | ; E. Map Button: Opens mapping for this equipment. | ||
| + | ; F. Alarm Level Icons: The top alarm level icon next to the Alarms section header shows the highest active alarm level for the current equipment. Each (grouped) alarm also has its own active alarm level icon that also shows the number of non dismissed alarm signals received. Clicking on these icons dismisses the alarm. | ||
| + | ; G. Favorite Icons | ||
| + | ; H. Reset Service Meter Icon: A service meter can be reset or initialize to a specific value. For more details, see [[Templates#Resettable Meters (a.k.a. Service Meters)|Service Meters]] | ||
| + | ::[[File:ConfirmResetServiceMeter.png]] | ||
| + | ; I. Alarm Group Icon: See [[Alarm Group Tutorial|Alarm Group Tutorial]] | ||
| + | ; K. History Buttons: A full history report for the current equipment can be opened with the history icon ('''E'''). For values, you can open a report in graph mode using '''J'''. (See [[Graph Mode|Graph Mode]]) Clicking on an alarm or value row displays a quick event history without opening a full report. | ||
| + | ; L. Show All Alarms Button: Toggles between showing only active alarms or all alarms even those that have been dismissed. | ||
| + | ; M. Show All Values Button: Toggles between showing only favorite values or all values. | ||
| − | + | == Info & Settings Tab == | |
| − | |||
| − | |||
| − | + | [[File:InfoandSettingsOverview.png]] | |
| − | |||
| − | |||
| − | |||
| − | [[File: | + | ; A. Menu: |
| + | ; B. Equipment Information: Some fields are editable. Click to edit. Press enter or click outside to save. | ||
| + | ; C. Operator Management: Click to assign an operator to the equipment. Some reports such as equipment reports, location reports, and alarm history reports will show an operator name who operates the equipment at the event time. The user drop-down list will show all user names except for the current operator of the equipment. If you need to add a new operator, click the New Operator icon and enter a name and a username. Our EMMS system will create new EMMS users automatically, but those users cannot login until their password is changed. | ||
| + | ::[[File:ManageOperator.png]] | ||
| + | ; D. Equipment Type: Click to change. | ||
| + | ::[[File:MachineTypeSelectSmall.png]] | ||
| + | ; E. Equipment Notes: Click to view and edit notes. | ||
| + | ::[[File:MachineNotesSmall.png]] | ||
| + | ; F. Reset Favorites: Click to reset values favorites to company defaults. | ||
| + | ; G. Dismiss Alarms: Click to dismiss all alarms for this equipment. | ||
| + | ; H. Confirm Install | ||
| − | + | ||
| − | + | If there are custom device settings configured in the advanced configuration template, they appear at the bottom of this tabs. | |
| + | |||
| + | == Actions Tab == | ||
| + | |||
| + | [[File:ActionsTabOverview.png]] | ||
| + | |||
| + | ; A. Menu: Contains link to Action History Report | ||
| + | ; B. Execute Action Button: Click to execute action on this equipment. This will often require sending a message to the equipment and may take some time depending on cellular connectivity. You will have the option to schedule the action for execution at later time. | ||
| + | ; C. Quick Action History Button: Shows a quick action history and status. Pressing on the 'X' button (when visible) cancels scheduled actions that have not been processed and sent to the equipment yet. | ||
| + | |||
| + | == Reports Tab == | ||
| + | |||
| + | Contains links to reports filtered on the current equipment. | ||
| + | |||
| + | == Diagnostic Tab == | ||
| + | |||
| + | Displays connectivity and diagnostic information about the DPL device. | ||
Latest revision as of 15:14, 2 November 2015
The Equipment Management screen displays information about a single piece of equipment organised into tabbed sections described bellow.
Dashboard Tab
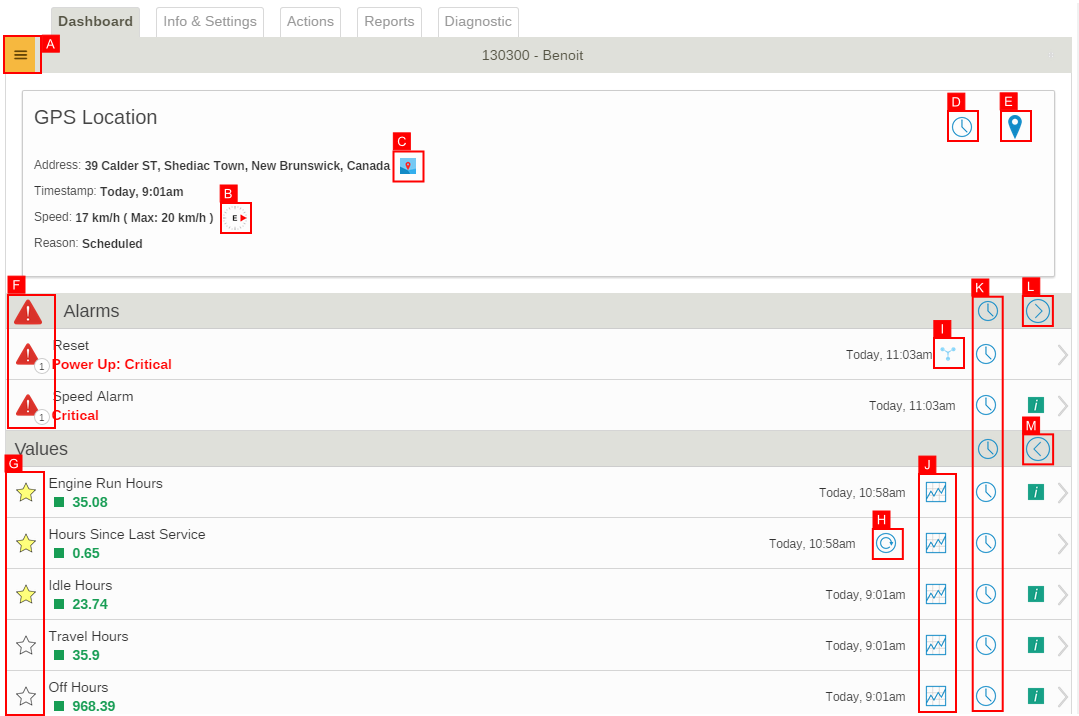
The Dashboard Tab displays location, alarm and value information.
- A. Menu with shortcuts available here
- B. Heading
- C. Quick Map Button
- Opens Quick Map popup.
- D. Location History Button
- Opens the Location History Report for this equipment.
- E. Map Button
- Opens mapping for this equipment.
- F. Alarm Level Icons
- The top alarm level icon next to the Alarms section header shows the highest active alarm level for the current equipment. Each (grouped) alarm also has its own active alarm level icon that also shows the number of non dismissed alarm signals received. Clicking on these icons dismisses the alarm.
- G. Favorite Icons
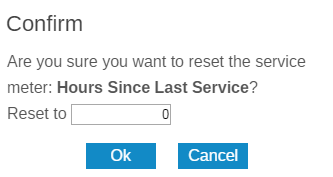
- H. Reset Service Meter Icon
- A service meter can be reset or initialize to a specific value. For more details, see Service Meters
- I. Alarm Group Icon
- See Alarm Group Tutorial
- K. History Buttons
- A full history report for the current equipment can be opened with the history icon (E). For values, you can open a report in graph mode using J. (See Graph Mode) Clicking on an alarm or value row displays a quick event history without opening a full report.
- L. Show All Alarms Button
- Toggles between showing only active alarms or all alarms even those that have been dismissed.
- M. Show All Values Button
- Toggles between showing only favorite values or all values.
Info & Settings Tab
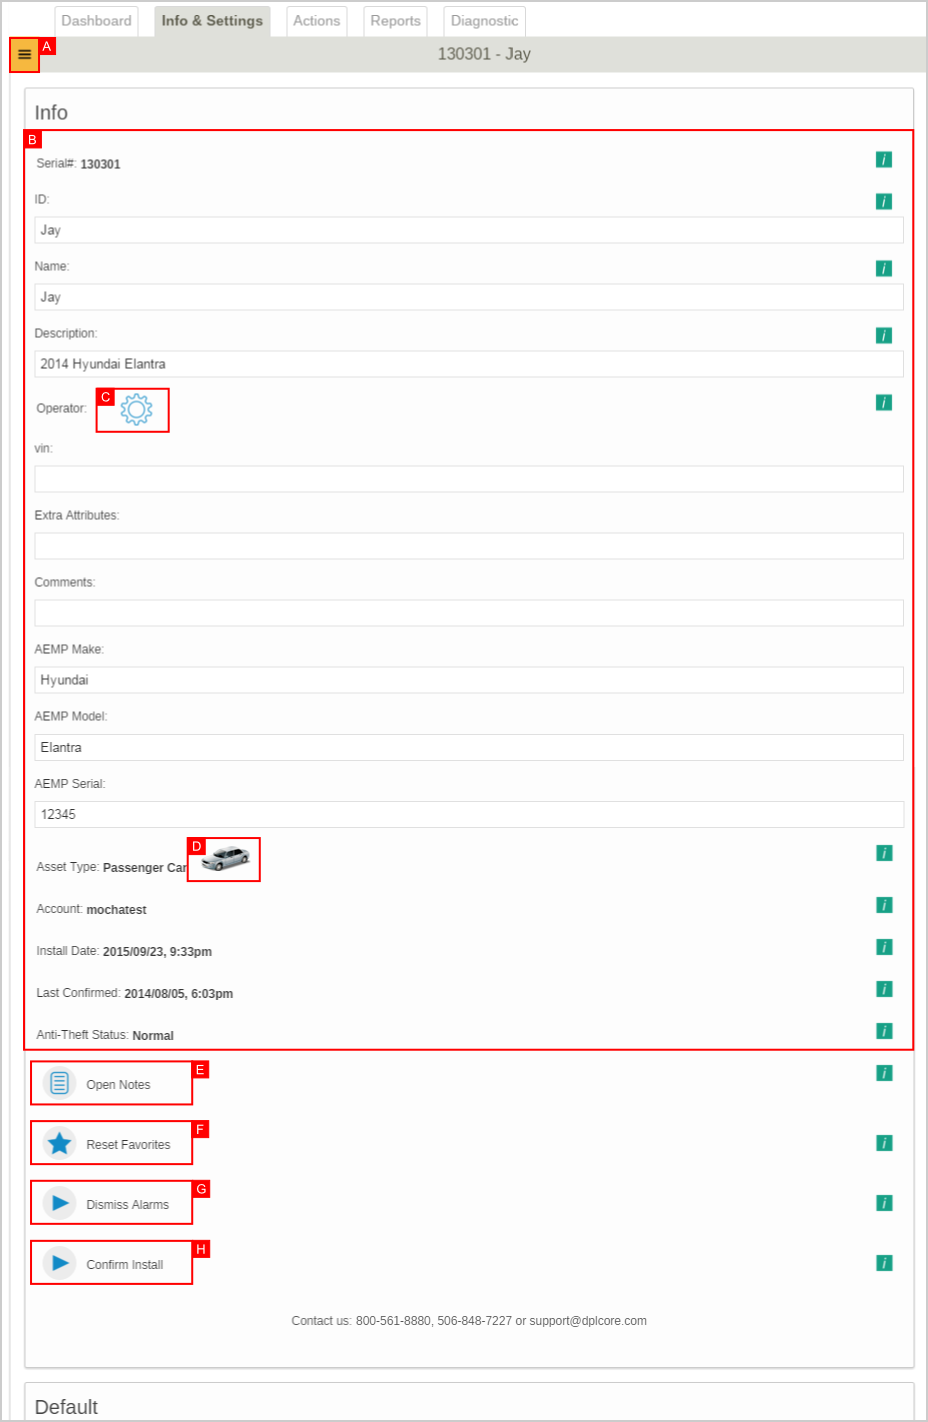
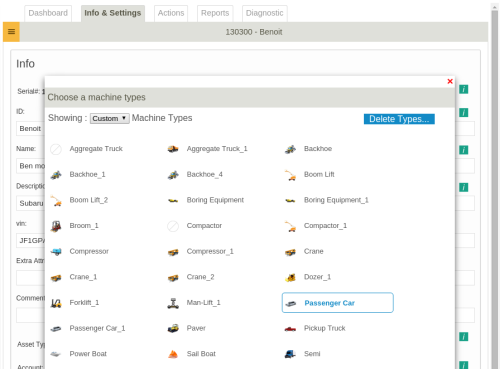
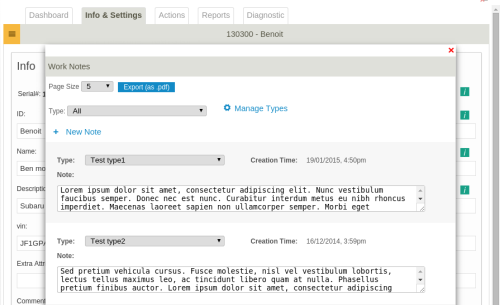
- A. Menu
- B. Equipment Information
- Some fields are editable. Click to edit. Press enter or click outside to save.
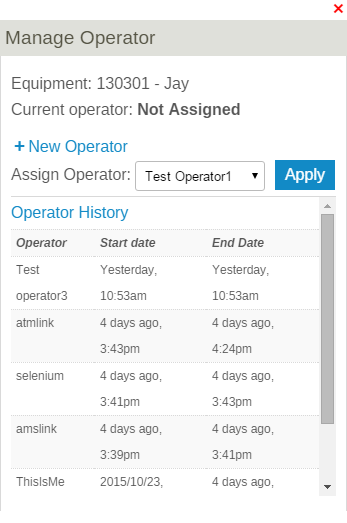
- C. Operator Management
- Click to assign an operator to the equipment. Some reports such as equipment reports, location reports, and alarm history reports will show an operator name who operates the equipment at the event time. The user drop-down list will show all user names except for the current operator of the equipment. If you need to add a new operator, click the New Operator icon and enter a name and a username. Our EMMS system will create new EMMS users automatically, but those users cannot login until their password is changed.
- F. Reset Favorites
- Click to reset values favorites to company defaults.
- G. Dismiss Alarms
- Click to dismiss all alarms for this equipment.
- H. Confirm Install
If there are custom device settings configured in the advanced configuration template, they appear at the bottom of this tabs.
Actions Tab
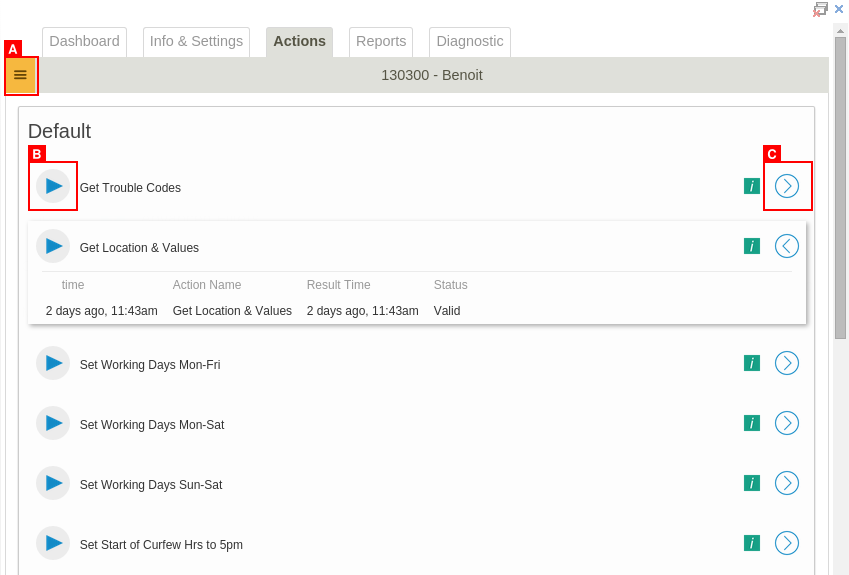
- A. Menu
- Contains link to Action History Report
- B. Execute Action Button
- Click to execute action on this equipment. This will often require sending a message to the equipment and may take some time depending on cellular connectivity. You will have the option to schedule the action for execution at later time.
- C. Quick Action History Button
- Shows a quick action history and status. Pressing on the 'X' button (when visible) cancels scheduled actions that have not been processed and sent to the equipment yet.
Reports Tab
Contains links to reports filtered on the current equipment.
Diagnostic Tab
Displays connectivity and diagnostic information about the DPL device.
